Waste Management
- Enhance the circular nature of production processes and use innovative technology (e.g., mixing dilute acid solutions and iron mud from different processes to form ferrous sulfate for wastewater treatment; using phosphoric acid solutions to create monosodium/disodium phosphate for manufacturing purposes; and using thin-film concentration techniques to improve solvent recovery).
- Utilize the shortest path in the outer loop of the circular economy (e.g., directly providing zinc sulfate, a by-product from our production process, to customers for the production of zinc oxide), cut waste at the source and actively encourage waste recycling, raising awareness and improving resource efficiency
- On-site Treatment: certain hazardous industrial waste (mainly solvent waste at ECIC Plant III) is treated on-site and the steam from the process is collected for further use
- Off-site Treatment: waste is collected by suppliers for recycling/reuse or contracted for third-party incineration. All outsourced waste disposal goes to nationally certified professional vendors (with no cross-border waste disposal practices)

Policy & Commitment
Governance Body
- The Company’s Environmental Management Committee
- Environmental management team and dedicated environmental protection unit at each plant
Management Approach
We have adopted the following waste management measures.
- Reuse and recycle more waste
- Classify and reduce waste at the source
- Ensure proper disposal and tracking of waste
Key Performance Indicator (KPI)
- Waste recycling and reuse rate (%): [Total amount of industrial waste recycled and reused / Total amount of industrial waste generated] × 100%
- Proper disposal rate of hazardous industrial waste (%): [Total amount of properly treated hazardous industrial waste / (Total amount of hazardous industrial waste generated – Temporary storage) ] × 100%
- Recycling rate of hazardous industrial waste (%): [Total amount of hazardous industrial waste recycled / Total amount of hazardous industrial waste generated] × 100%.
Evaluation Mechanism
- Environment management reviews (annual)
- ESG Committee meetings (twice every year)
- Plant policy reviews (annual)
- Internal audits on our environment management system (annual)
- External audits on our environmental management system by DNV (annual)
- Evaluation of waste disposal/management vendors (annual)
Targets
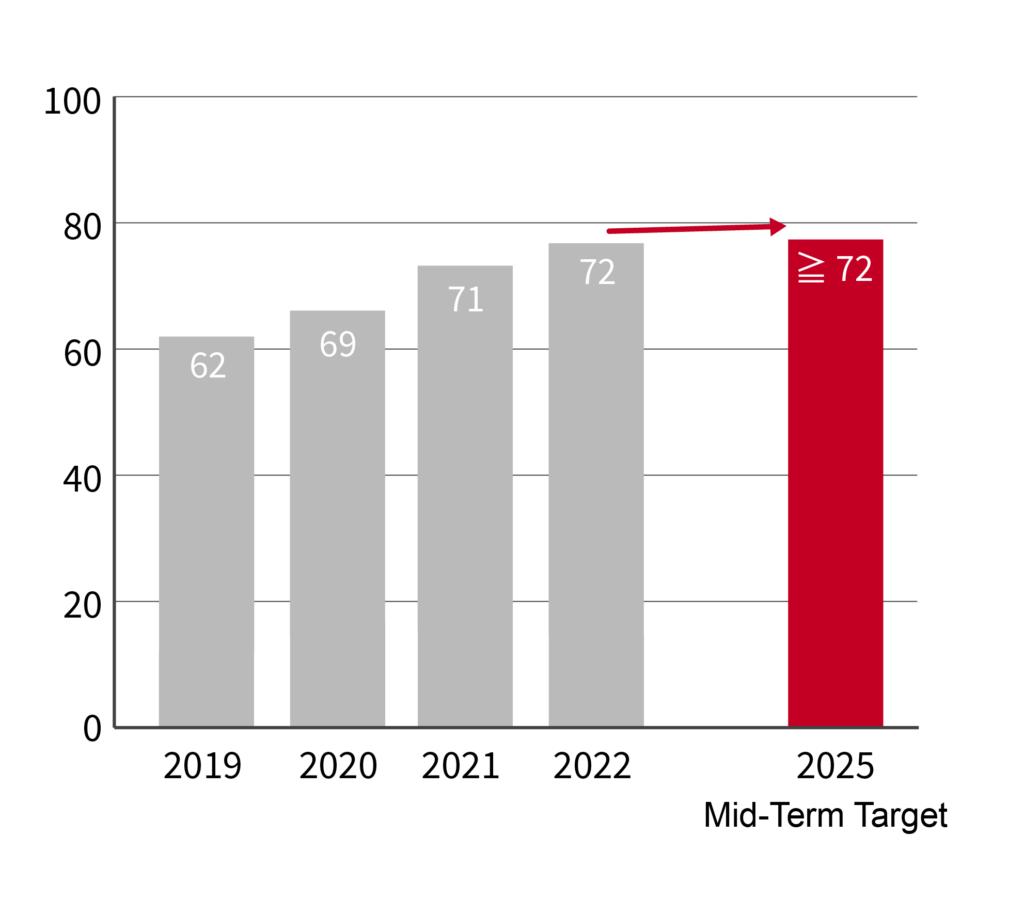
- Waste recycling and reuse rate: ≧72% (2025); ≧73% (2030)
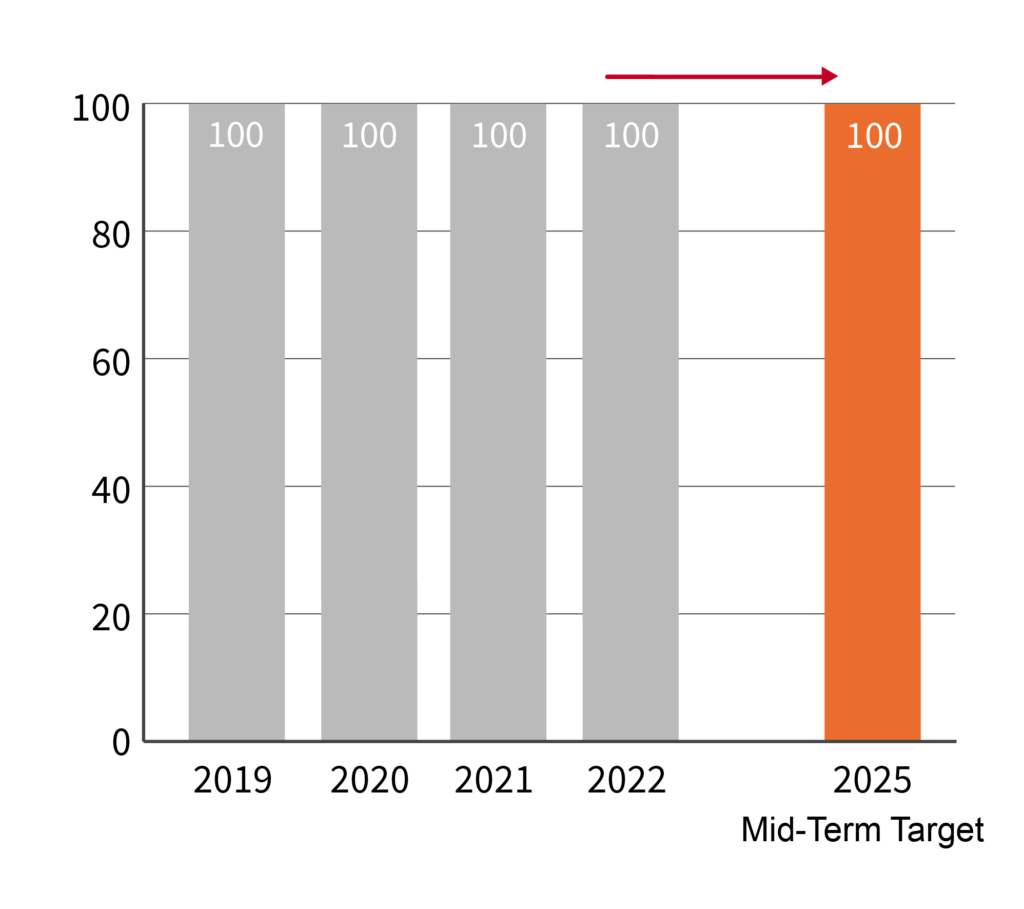
- Proper disposal rate of hazardous industrial waste: 100% (2025); 100% (2030)
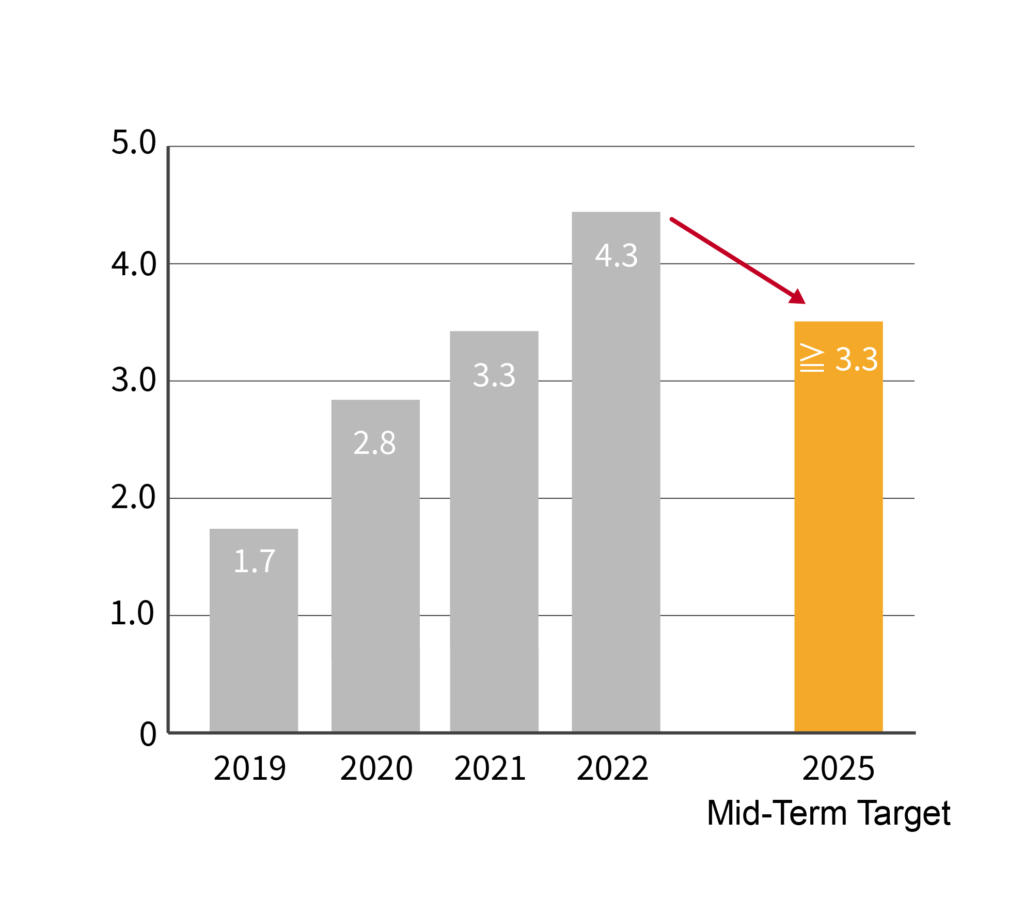
- Recycling rate of hazardous industrial waste: ≧3.3% (2025); ≧3.5% (2030)
Resource Investment
- Develop circular economy practices
- Promote green chemistry practices
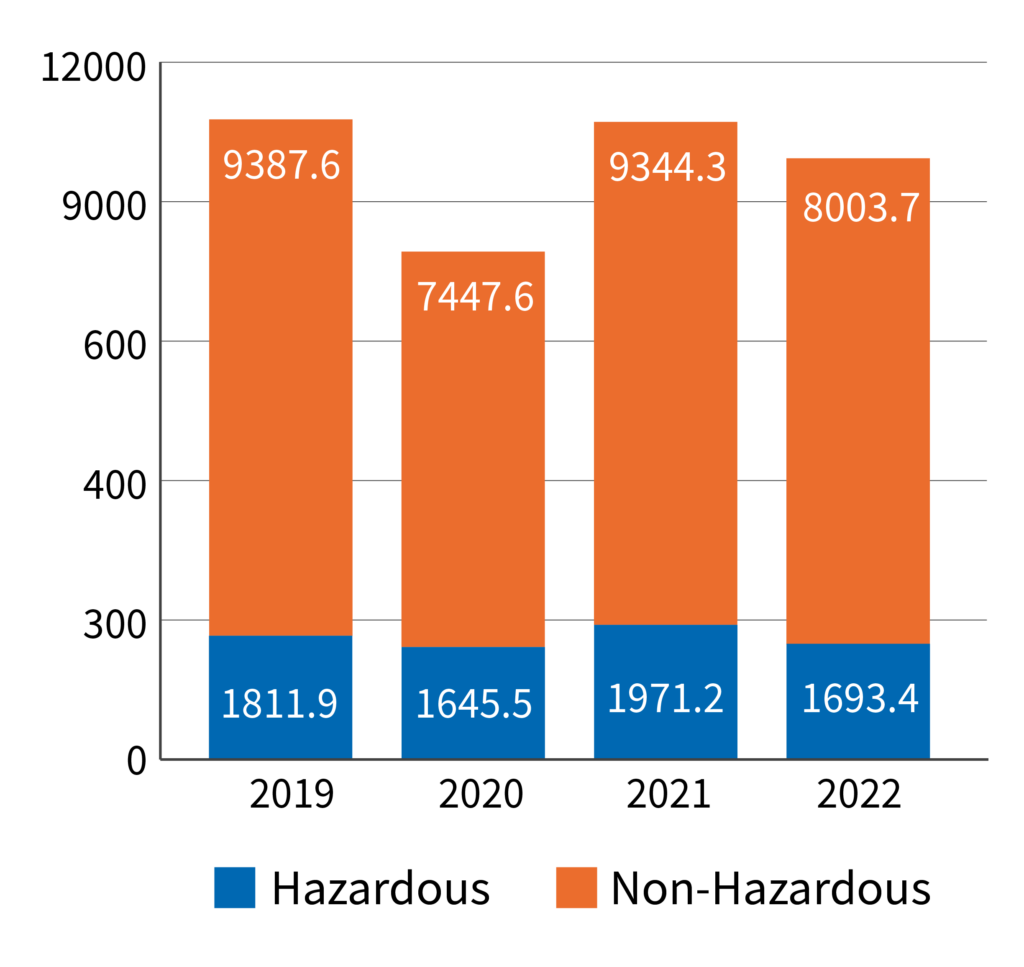
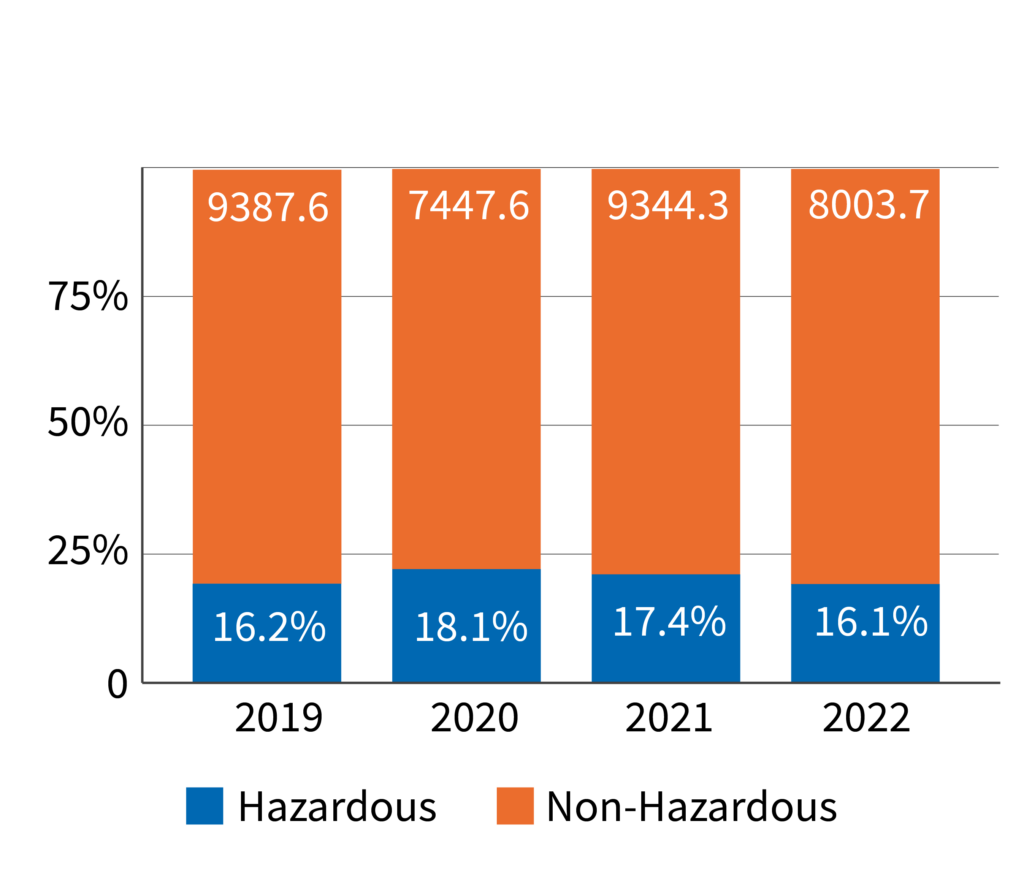
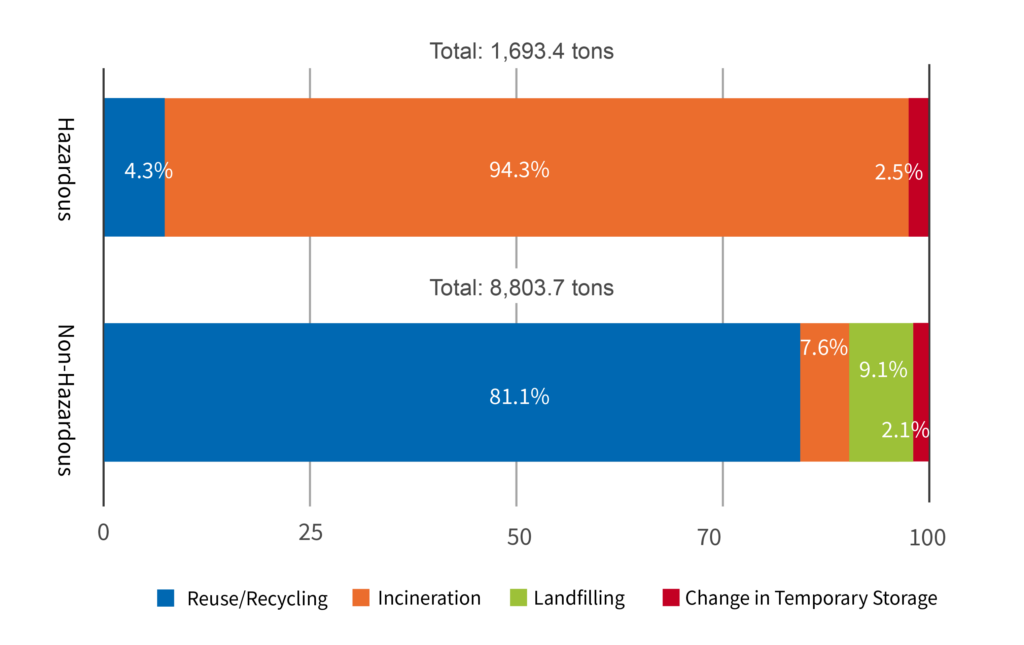
In 2022, the total weight of industrial waste generated was 10,497.4 tons (including 1,693.4 tons of hazardous industrial waste and 8,804.0 tons of general industrial waste), representing a 7% decrease compared to that of 2021 (11,315.5 tons). The total weight of recycled and reused waste was 7,534.8 tons, representing a high waste recycling and reuse rate of 72%. From the total amount of waste generated, we were also able to recycle 73.1 tons of hazardous industrial waste (representing a 4.3% recycling rate for hazardous industrial waste). Both waste recycling and reuse rate and recycling rate of hazardous industrial waste continued to increase, thanks to measures like packaging material recycling (e.g., vacuum storage bags, one-way containers, plastic bags, etc.) and reusing hazardous solvent waste (PGMEA) by streamlining processes.
Location | Year | Waste Type | Disposal Method (Note 1) | Subtotal (Note 2) | Total Waste Generated | |||
Reuse /Recycling | Incineration | Landfilling | Change in Temporary Storage | |||||
ECIC Plant I-IV | 2019 | Hazardous | 30.8 | 1,709.1 | 0 | -30.1 | 1,709.8 | 10,845.0 |
Non-Hazardous | 6,864.5 | 498.5 | 1,805.1 | -32.9 | 9,144.2 | |||
2020 | Hazardous | 46.9 | 1,372.0 | 0 | 34.4 | 1,453.3 | 8,634.8 | |
Non-Hazardous | 6,184.1 | 416.5 | 531.4 | 49.5 | 7,181.5 | |||
2021 | Hazardous | 64.4 | 1,727.2 | 0 | 61.6 | 1,853.2 | 10,874.4 | |
Non-Hazardous | 7,892.6 | 391.7 | 660.6 | 76.3 | 9,021.2 | |||
2022 | Hazardous | 60.2 | 1,598.4 | 0 | -44.3 | 1,614.3 | 10,102.9 | |
Non-Hazardous | 7,403.5 | 557.3 | 662 | -134.2 | 8,488.6 | |||
Trend Tone Imaging | 2019 | Hazardous | 0 | 0.2 | 0 | 0 | 0.2 | 224.7 |
Non-Hazardous | 48.1 | 176.4 | 0 | 0 | 224.5 | |||
2020 | Hazardous | 0 | 0.4 | 0 | 0 | 0.4 | 246 | |
Non-Hazardous | 62.8 | 167.9 | 14.9 | 0 | 245.6 | |||
2021 | Hazardous | 0 | 0.2 | 0 | 0 | 0.2 | 306.8 | |
Non-Hazardous | 35.3 | 146.7 | 63.3 | 61.3 | 306.6 | |||
2022 | Hazardous | 0 | 0 | 0 | 0 | 0 | 289.8 | |
Non-Hazardous | 47.7 | 126.8 | 176.6 | -61.3 | 289.8 | |||
Everlight Suzhou | 2019 | Hazardous | 0 | 101.9 | 0 | 0 | 101.9 | 120.8 |
Non-Hazardous | 18.9 | 0 | 0 | 0 | 18.9 | |||
2020 | Hazardous | 0 | 192.8 | 0 | 0 | 192.8 | 213.3 | |
Non-Hazardous | 20.5 | 0 | 0 | 0 | 20.5 | |||
2021 | Hazardous | 0 | 117.4 | 0 | 0.4 | 117.8 | 134.3 | |
Non-Hazardous | 15.4 | 0 | 0 | 1.1 | 16.5 | |||
2022 | Hazardous | 12.9 | 65.6 | 0 | 0.6 | 79.1 | 104.7 | |
Non-Hazardous | 10.5 | 16.2 | 0 | -1.1 | 25.6 | |||
Note:
- To ensure a more accurate representation of the total volume of waste generated for each year, we have also calculated and disclosed changes in temporary storage in our sustainability reporting this year.
- On-site storage represents the volume of waste in temporary storage at the end of the year, while other information is the sum of the quantity for each month rounded to one decimal place.
- Total waste generated = Total waste disposed during the year + Change in temporary storage.
- The above information includes waste that is subject to declaration as well as waste exempt from declaration (such as scrap metal, plastic waste, and paper waste, whose figures are based on weight note records) and is presented in tons.
- For 2022, on-site waste treatment included waste handled with incineration at ECIC Plant III (1,123.6 tons) and penetrant waste (for ink products) recycled and reused at Everlight Suzhou (12.9 tons). The rest of the waste was treated off-site.
No Data Found
No Data Found
Note:
- On-site storage represents the volume of waste in temporary storage at the end of the year, while other information is the sum of the quantity for each month rounded to one decimal place.
- Total waste generated = Total waste disposed during the year + Change in temporary storage.
- The above information includes waste that is subject to declaration as well as waste exempt from declaration (such as scrap metal, plastic waste, and paper waste, whose figures are based on weight note records) and is presented in tons.
Waste Recycling & Reuse Rate
Proper Disposal Rate of Hazardous Industrial Waste
Recycling Rate of Hazardous Industrial Waste