Pollution Prevention
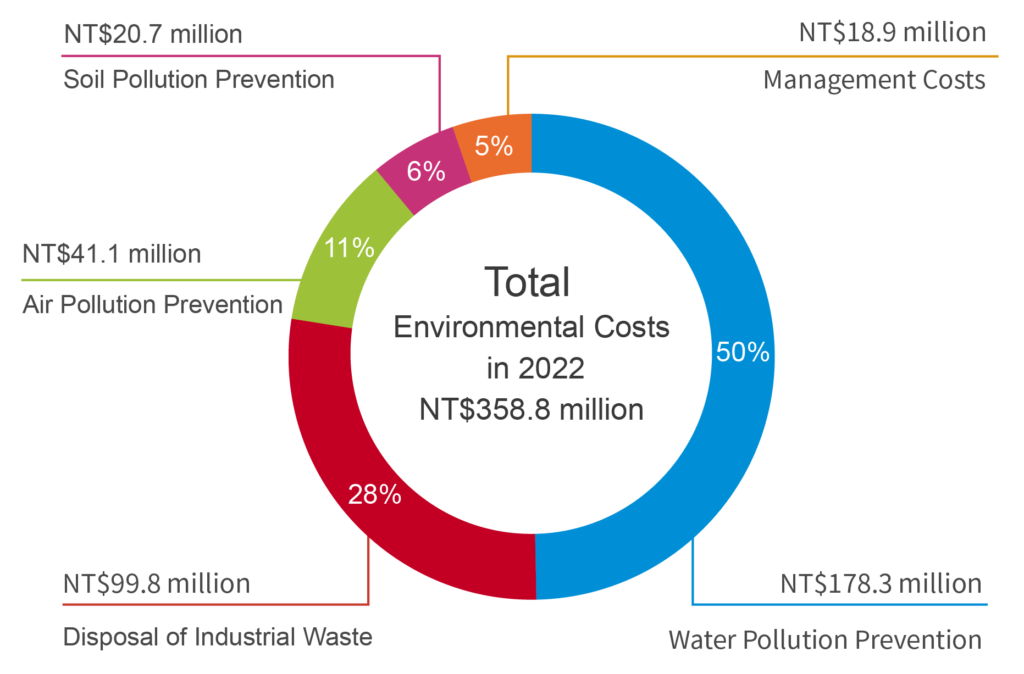
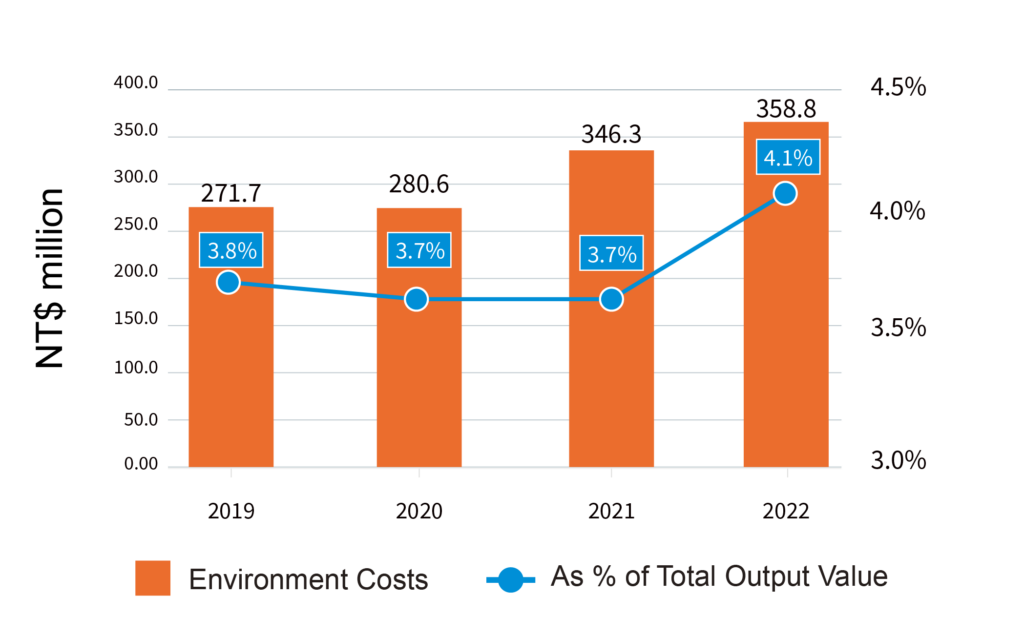
In 2022, our total environmental costs were NT$358.8 million, equivalent to 4.1% of total output value. Measures to prevent water pollution accounted for the largest share of the costs. We continued to ensure proper wastewater treatment at all production facilities and comply with regulatory requirements related to water discharge (our wastewater treatment compliance rate was 100% across the board).
Management Focus | Performance Indicator | 2021 (Actual) | 2022 (Actual) | 2022 (Target) | Short-Term Target (2023) | Mid-Term Target (2025) | Long-Term Target (2030) |
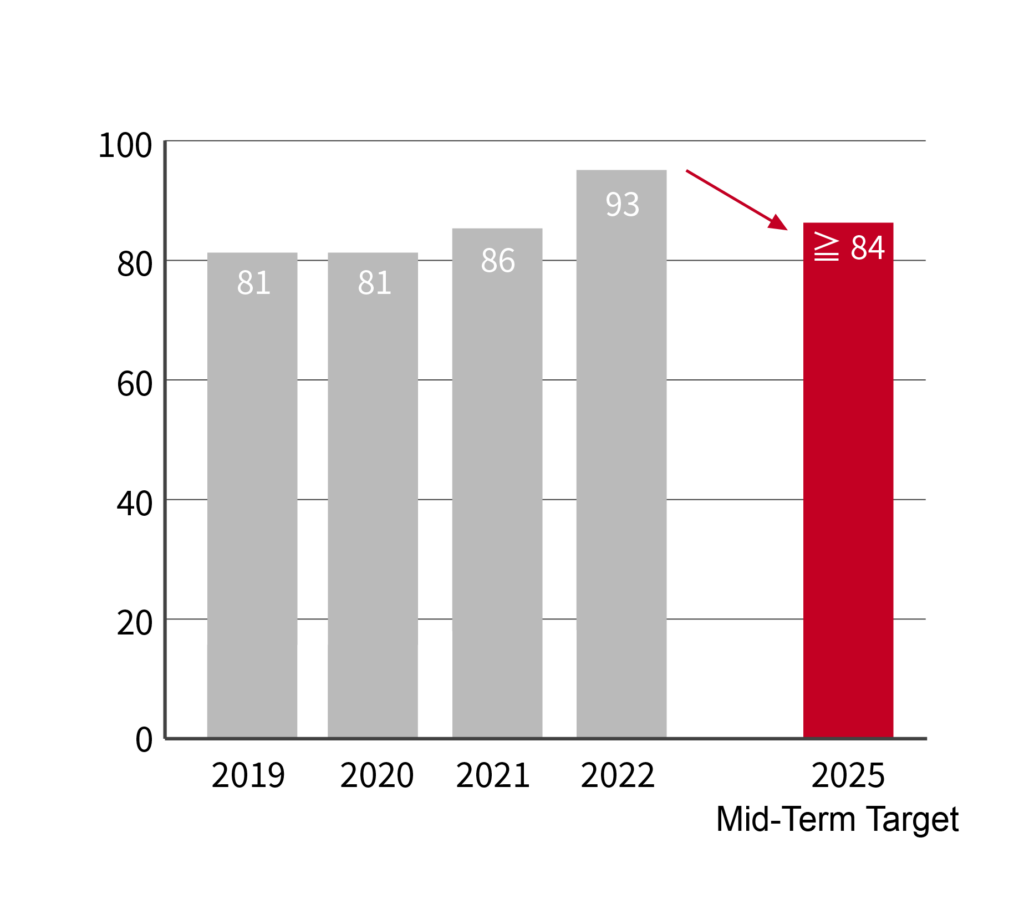
Water Pollution Prevention | Water Recovery Rate (R2) (%) | 86 | 93 | ≧ 83 | ≧ 84 | ≧ 84 | ≧ 86 |
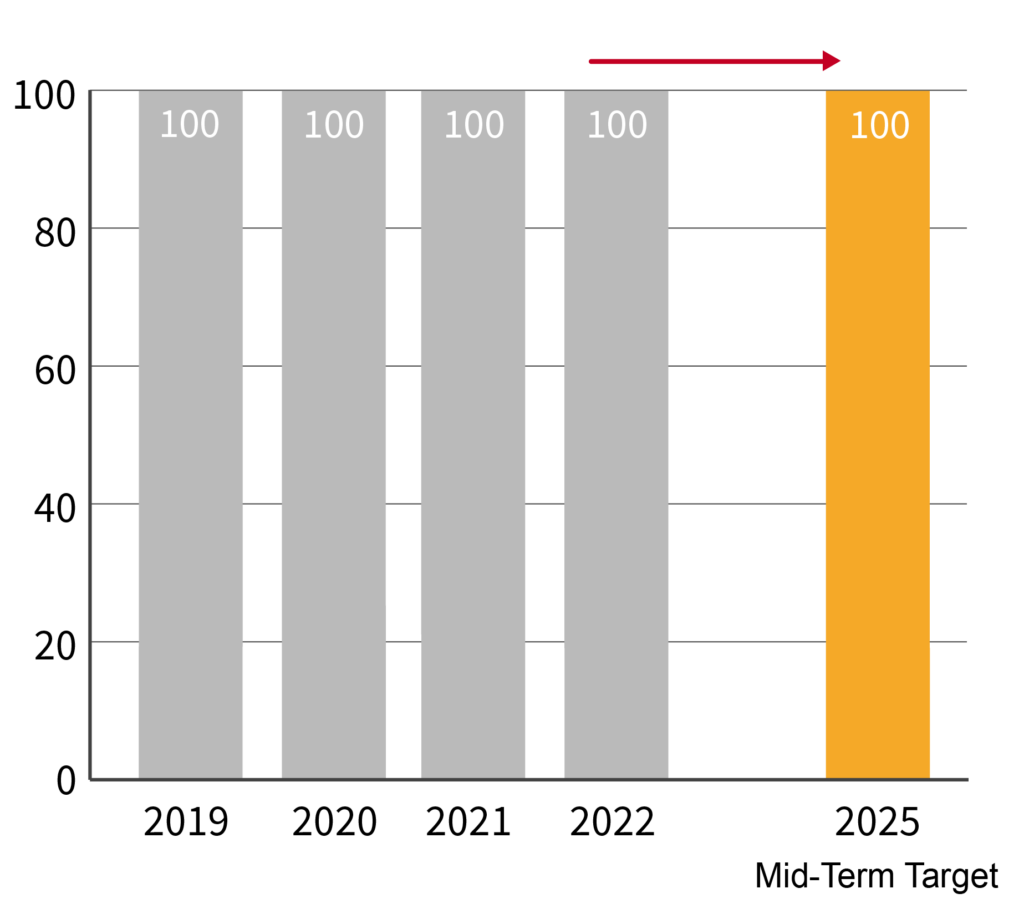
Wastewater Treatment Compliance Rate (%) | 100 | 100 | 100 | 100 | 100 | 100 | |
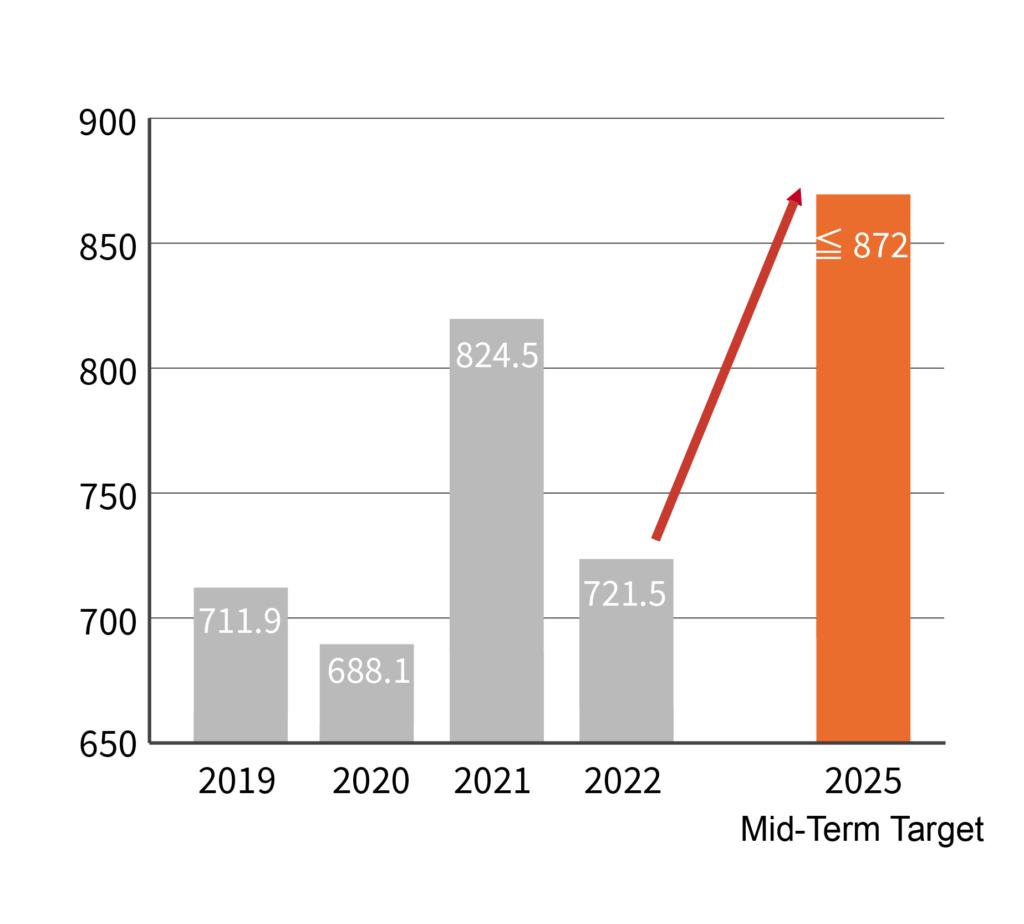
Total Water Withdrawal (ML) | 824.5 | 721.5 | ≦ 872 | ≦ 872 | ≦ 872 | ≦ 872 | |
Air Pollution Prevention | Emissions Reduction Rate per Unit of Production (%) | 6 | -3 | ≧ 5 | ≧ 2 | ≧ 3 | ≧ 4 |
Waste Management | Waste Recycling & Reuse Rate (%) | 71 | 72 | ≧ 70 | ≧ 71 | ≧ 72 | ≧ 73 |
Proper Disposal Rate of Hazardous Industrial Waste (%) | 100 | 100 | 100 | 100 | 100 | 100 | |
Recycling Rate of Hazardous Industrial Waste (%) | 3.3 | 4.3 | ≧ 3.1 | ≧ 3.1 | ≧ 3.3 | ≧ 3.5 | |
Resource Efficiency | Atom Efficiency (%) | 67.1 | 70.9 | ≧ 66.6 | ≧ 69.0 | ≧ 69.3 | To be adjusted based on biannual review |
GHG Inventory and Energy Use* | Electricity Savings (%) | 1.2 | 1.1 | ≧ 1 | ≧ 1 | ≧ 1 | ≧ 1 |
Energy Intensity (GJ/NT$mm output) | 80 | 72 | ≦ 85 | ≦ 79 | ≦ 77 | ≦ 74 | |
GHG Emissions Intensity (tCO2e/NT$mm output) | 8.9 | 8.3 | ≦ 8.6 | ≦ 8.7 | ≦ 8.1 | ≦ 6.8 |
Policy & Commitment
Governance Body
- The Company’s Environmental Management Committee
- Environmental management team and dedicated environmental protection unit at each plant
Management Approach
- Water withdrawal: enhance water recycling measures and conduct water use surveys
- Water discharge: enhance wastewater treatment effectiveness and regularly inspect the quality of treated wastewater
- Regularly assess if any production site is at risk of being located in water-stressed areas
Key Performance Indicators (KPI) for Water Resource Management
- Water Withdrawal: Total water withdrawal (ML) = Sum of water withdrawal from all sources (tap water, groundwater, and industrial water)
- Water Discharge: Wastewater treatment compliance rate (%) = [Amount of discharged water within the limit set by competent authorities / Total water discharge] x 100%
- Water Recovery: Water Recovery Rate R2 (%) = [(Total water recycled + Total water circulation)/(Total water withdrawal + Total water recycled + Total water circulation)] x 100%
Evaluation Mechanism
- Environment management reviews (annual)
- ESG Committee meetings (twice every year)
- Plant policy reviews (quarterly)
- Internal audits on our environment management system (annual)
- External audits on our environmental management system by DNV (annual)
Targets
- Water Withdrawal: Total water withdrawal (ML): ≦872ML (2025, 2030)
- Water Discharge: Wastewater treatment compliance rate (%): 100% (2025, 2030)
- Water Recycling: Water recovery rate (R2) (%): ≧84% (2025), ≧86% (2030)
Resource Investment
- Develop water recycling system, ozone catalytic oxidation (OZCO) techniques and membrane distillation (MD) techniques
- Adopt Aqueduct Water Risk Atlas, an analytics tool by the World Resources Institute, to evaluate possible impacts on water resources
I. Water Withdrawal Management
Our sources of water withdrawal include groundwater, tap water, and water for industrial use. When devising plans related to water resource usage, we consider government policy, company strategy, industry development and the water resource needs of local communities. For example, we collaborate with competent authorities to install groundwater intakes for local residential use during drought seasons. Through measures like this, we allocate water resources in a reasonable and efficient way and make sure that our water withdrawal volume/methods do not pose material negative impacts on the local ecosystem or communities.
2019-2022 Water Withdrawal & Water Consumption
Plant I-IV
No Data Found
Trend Tone Imaging
No Data Found
Everlight Suzhou
No Data Found
Note:
- Values in the above charts are rounded to one decimal place.
- Values are presented in megaliters. All water sources listed are freshwater sources with a total dissolved solid (TDS) level equal to or lower than 1,000 mg/L.
- Water Consumption = Total Water Withdrawal – Total Water Discharge
- We were able to reduce water consumption mainly thanks to successful water usage optimization in the production process of our digital textile printing ink products (collecting penetrants to be used in the desalination process) as well as other water recovery measures, which helped reduce the consumption of purified water.
- Total water consumption was 109.9ML and 126.7ML in 2022 and 2021 respectively.
II. Water Discharge Management
Domestic sewage and industrial wastewater produced by each plant are discharged to and treated by the sewage system of industrial parks or municipal sewer networks (wastewater from Plant I goes to the wastewater treatment plant in Dayuan Industrial Park, Plant II and Plant III to the wastewater treatment plant in Guanyin Industrial Park, Plant IV to the wastewater treatment plant in Taoyuan Industrial Park, Trend Tone Imaging to the wastewater treatment plant in Hsinchu Science Park, and Everlight Suzhou to the wastewater treatment plant in Suzhou Industrial Park). Wastewater discharged from all Everlight Chemical facilities meets the standards set by each wastewater treatment plant.
Plant I
Plant II
Plant III
Plant IV
- To comply with the wastewater discharge standards of Dayuan Industrial Park and support the government’s efforts to improve the water quality of Laojie River, starting from November, 2021,Plant I’s wastewater discharge is included in the effluent management system of Dayuan Industrial Park. The water quality treatment standards remained the same.
- A small portion of wastewater of Trend Tone Imaging is stored for third-party disposal as waste. The rest consists mostly of domestic sewage and is directed to the sewage system of the Hsinchu Science Park for treatment.
- Each plant’s discharge standards comply with the standards set by local authorities and industry standards.
- Wastewater discharged from each plant has no significant impacts on receiving waters and habitats.
Wastewater Treatment Compliance Rate (%) = [Amount of Discharged Water within the Limit Set by Competent Authorities / Total Water Discharge] x 100%
No Data Found
Note:
- Water discharge disclosed above is categorized based on GRI 303. The concentration of total dissolved solids (TDS) of water discharged from Trend Tone Imaging is ≤1,000 mg/L and is thus classified as freshwater. While TDS concentration of discharged water from other plants is ≧1,000 mg/L and is classified as other water. Values are presented in megaliters.
- Values in the charts above are rounded to one decimal place.
We have selected chemical oxygen demand (COD), suspended solids (SS), ammonia nitrogen and nitrate nitrogen as priority substances for wastewater treatment and disclosure. We referred to standards set by local authorities to manage related discharge.
COD
(mg/L)
No Data Found
SS
(mg/L)
No Data Found
Ammonia Nitrogen
(mg/L)
No Data Found
Nitrate Nitrogen
(mg/L)
No Data Found
Note:
- Manufacturing processes and discharge standards at each plant vary. Therefore, treatment and water quality standards are different.
- Wastewater from Trend Tone Imaging is classified as domestic sewage and therefore Trend Tone Imaging does not have any industrial wastewater that requires treatment.
- The average discharge concentration is derived by calculating the average value of reported testing figures and rounding it to one decimal place.
- Plant I complies with the effluent discharge standards of Dayuan Industrial Park and the plant’s water quality treatment standards remain the same.
III. Water Recycling and Reuse
Everlight Chemical has a long history of implementing water conservation measures. Early-on approaches included reducing daily water usage and installing equipment for water recovery and reuse, all of which have yielded tangible results. To further improve water conservation, in 2022, we began using the R2 water recovery rate (excluding cooling water circulation) as a key performance indicator to help us better understand current performance in water consumption, conservation and recycling so that we can review and assess the effectiveness of water policies and measures.
In 2022, the total water recycled and total water circulation combined amounted to 9,381.5 megaliters, equivalent to a water saving volume of 3,753 standard swimming pools.* Our R2 water recovery rate for the year was 93%, representing a 7% increase from 2021 (86%). The accomplishment mainly resulted from successful water usage optimization in the production process of our digital textile printing ink products, where penetrants were collected to be reused in the desalination step, which helped reduce the consumption of purified water. Everlight Chemical will continue to implement other water recovery and reuse measures (for example, considering ways to make use of water circulated in the scrubbing towers).
2019-2022 Total Water Recycled & Total Water Circulation
No Data Found
No Data Found
Overview of Water Resource Management & Pollution Prevention Performance
Note: We started to include subsidiaries in the monitoring of these indicators in 2021. To that end, we have referenced the headquarters’ 2018-2020 performance and future plans to devise feasible mid- and long-term targets for the Group as a whole.
Air pollution prevention is a key area under the material topic of pollution prevention. On top of compliance with related regulations, Everlight Chemical implements air pollution prevention measures that exceed regulatory requirements. We also use low-polluting and clean energy sources as much as possible and improve manufacturing processes to reduce emissions of sulfur oxides (SOx) and nitric oxides (NOx). To further improve practices related to air pollution discharge, we closely monitor and reference the latest domestic emissions standards such as the Stationary Pollution Source Hazardous Air Pollutant Emissions Standards. Our management approach for air pollution prevention is as follows:
Policy & Commitment
Governance Body
- The Company’s Environmental Management Committee
- Environmental management team and dedicated environmental protection unit at each plant
Management Approach
We have implemented the following measures to protect air quality.
- Use clean fuels
- Install more pollution prevention equipment
- Strengthen the availability of pollution prevention equipment
Key Performance Indicator (KPI)
Evaluation Mechanism
- Environment management reviews (annual)
- ESG Committee meetings (twice every year)
- Plant policy reviews (quarterly)
- Internal audits on our environment management system (annual)
- External audits on our environmental management system by DNV (annual)
Targets
- Gradually increase the emissions reduction rate per unit of production: Mid-term target ≧3% (2025); Long-term target ≧4% (2030)
Resource Investment
- Introduce the best processing technologies
- Enhance inspections on pollution prevention equipment
2019-2022 Air Pollution Emissions
Plant I-IV
No Data Found
No Data Found
Note:
- Production volume includes finished products and certain cross-plant semi-finished products.
- Figures disclosed above are in tons and are based on reported figures for the year. The values are rounded to two decimal places.
- Starting from 2016, Plant I-IV have been gradually replacing oil-fired boilers with low-pollution boilers that use clean energy sources, which has yielded tangible results in reducing SOx and NOx (reduced by 90~98% and 52~59% respectively; further details can be found in air pollution discharge disclosures in our 2018-2020 ESG reports).
Emission Reduction Rate per Production Unit Over the Years (Unit: Ton)
KPI | 2019 | 2020 | 2021 | 2022 | 2025 Target **** |
Total Air Pollutant Emissions (Group) | 66.56 | 83.90 | 73.08 | 80.30 | – |
Total Production Volume (Group) | 39,225 | 35,561 | 40,120 | 40,323 | – |
Air Pollution Emission per Unit of Production* | 1.70 | 2.36 | 1.82 | 2.01 | – |
Emissions Reduction Rate per Unit of Production** % | 12 | -22*** | 6 | -3 | ≧3 |
Note:
*Air pollutant emissions per production unit calculated by dividing the total volume of air pollutants (kg), including particulate matters (PM), by production volume (t).
**Emissions reduction rate per unit of production (%): [1 – Air pollutant emissions per production unit) / Benchmark (1.93))] x 100%
***The -22% emissions reduction rate per unit of production in 2020 mainly resulted from reduced production capacity due to the COVID-19 pandemic and increased production volume of products with a higher emission factor (as the reduction rate was reported based on emission factors). Increased production volume was from our solvent product production line as market demand for related products (e.g. cleaning products and photoresists) surged during that year, causing the emission of VOCs to increase by 24%.
****We started to include subsidiaries in the monitoring of these indicators in 2021. To that end, we have referenced the Group’s 2018-2020 performance and future plans to devise feasible mid- and long-term targets for the Group as a whole.