GHG Inventory and Energy Management
Policy & Commitment
We continue to monitor international trends related to climate change and prioritize GHG emissions reduction. We continue to implement energy conservation measures such as energy management and equipment efficiency improvements to reduce our GHG emissions and maximize resource efficiency.
In addition, we will continue to employ energy management systems and innovative equipment to facilitate carbon reduction and energy conservation and reduce the potential impacts of climate change.
Governance Body
- The Company’s Environmental Management Committee
- Environmental management team and dedicated environmental protection unit at each plant
Management Approach
We have taken the following measures to control and reduce GHG emissions.
- Improve manufacturing processes and equipment
- Introduce innovative management techniques
- Conduct GHG inventory following ISO 14064-1 or standards set by competent authorities*
- Continue to promote GHG emissions reduction measures
Key Performance Indicator (KPI)
- Electricity savings (%): [Electricity savings/ (Total electricity consumption + Electricity savings)] x 100%
- GHG emissions intensity: Total GHG emissions ((Scope1+Scope2) tCO2e)/NT$mm output
- Energy intensity: Total energy consumption (GJ)/NT$mm output
Evaluation Mechanism
- Environmental management review (annual)
- ESG Committee meetings (twice every year)
- Plant policy review (quarterly)
- Internal audit on our environment management system (annual)
- External audit on our environmental management system by DNV (annual)
Targets
- Electricity savings (%): ≧1% (2025); ≧1% (2030)
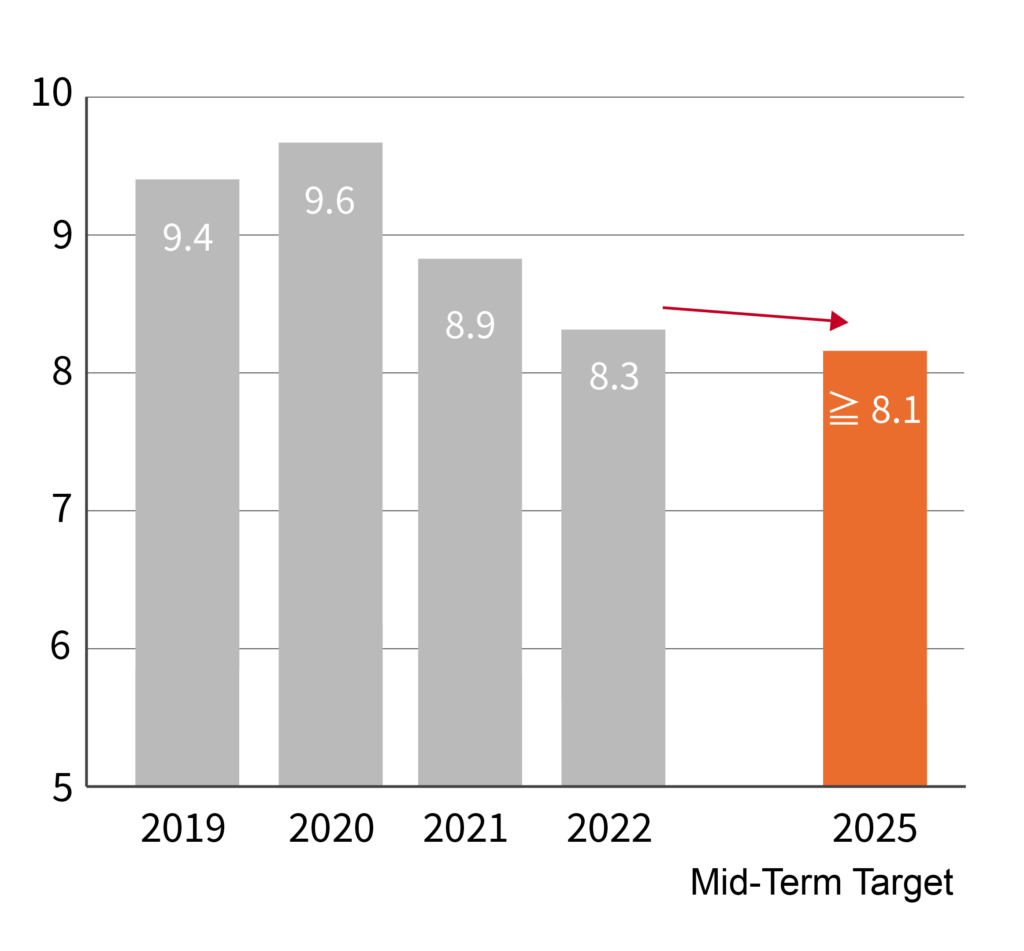
- GHG emissions intensity (tCO2e/NT$mm output): ≦8.1 (2025); ≦6.8 (2030)
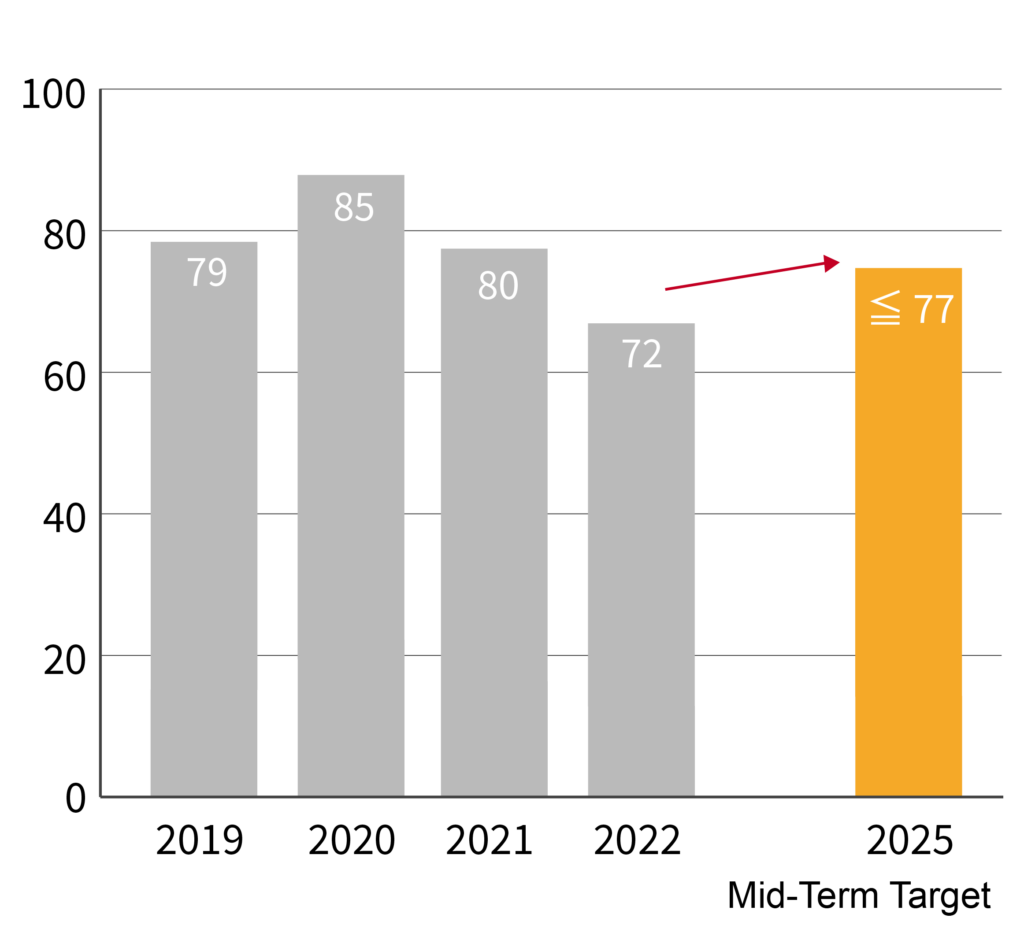
- Energy intensity (GJ/NT$mm output): ≦77 (2025); ≦74 (2030)
Resource Investment
- Utilize energy conservation equipment
- Implement energy management systems
- Invest in and develop renewable energy capabilities
- Establish the Climate Change Working Group
- Adopt measures to increase energy efficiency of our products
Energy Management (Energy Intensity Management)
2019-2022 Energy Consumption
ECIC Plant I-IV
No Data Found
Trend Tone Imaging
No Data Found
Everlight Suzhou
No Data Found
- Note:
- The figures are in 103GJ.
- The figures above are calculated based on heating values published by the Bureau of Energy. For example, the heating value of electricity is 860 kcal/kWh and the heating value of natural gas is 8,000 kcal/m3.
- Energy consumption (GJ) =〔Energy consumption for each energy source (unit) X Heating value of each energy source (kcal/unit) X Heating value coefficient (4.187 x 10³J/kcal)〕÷109.
- The figures are rounded to two decimal places.
- Reduction of energy consumption is calculated with 2021 as the base year to represent changes in energy consumption of the year in relation to the previous year.
Historical Energy Intensity Performance
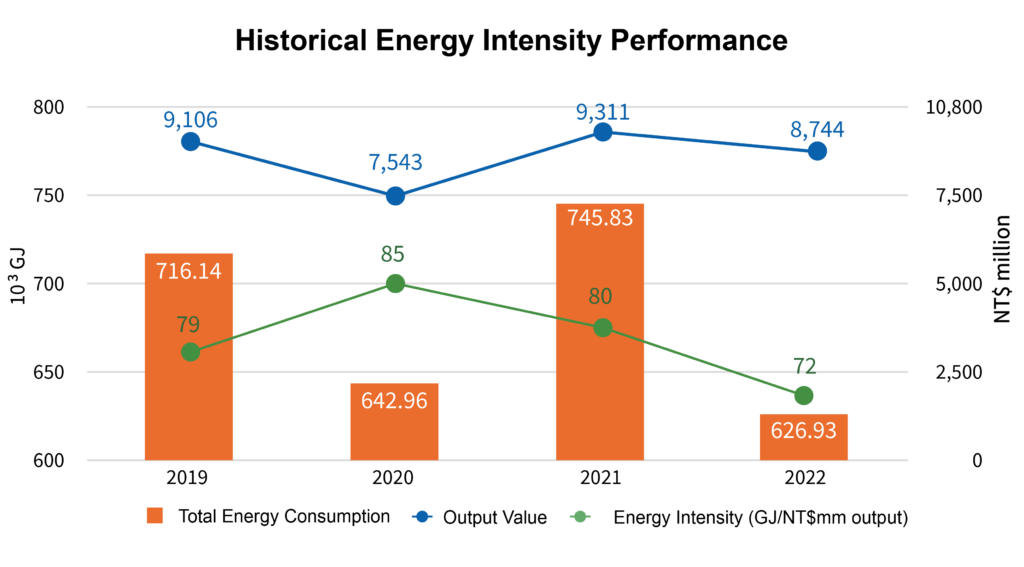
Note: Because of COVID-19, the production output value of 2020 was only 83% of that of 2019. We were able to keep the energy intensity at 85 without surging drastically, thanks to the implementation of various energy conservation measures.
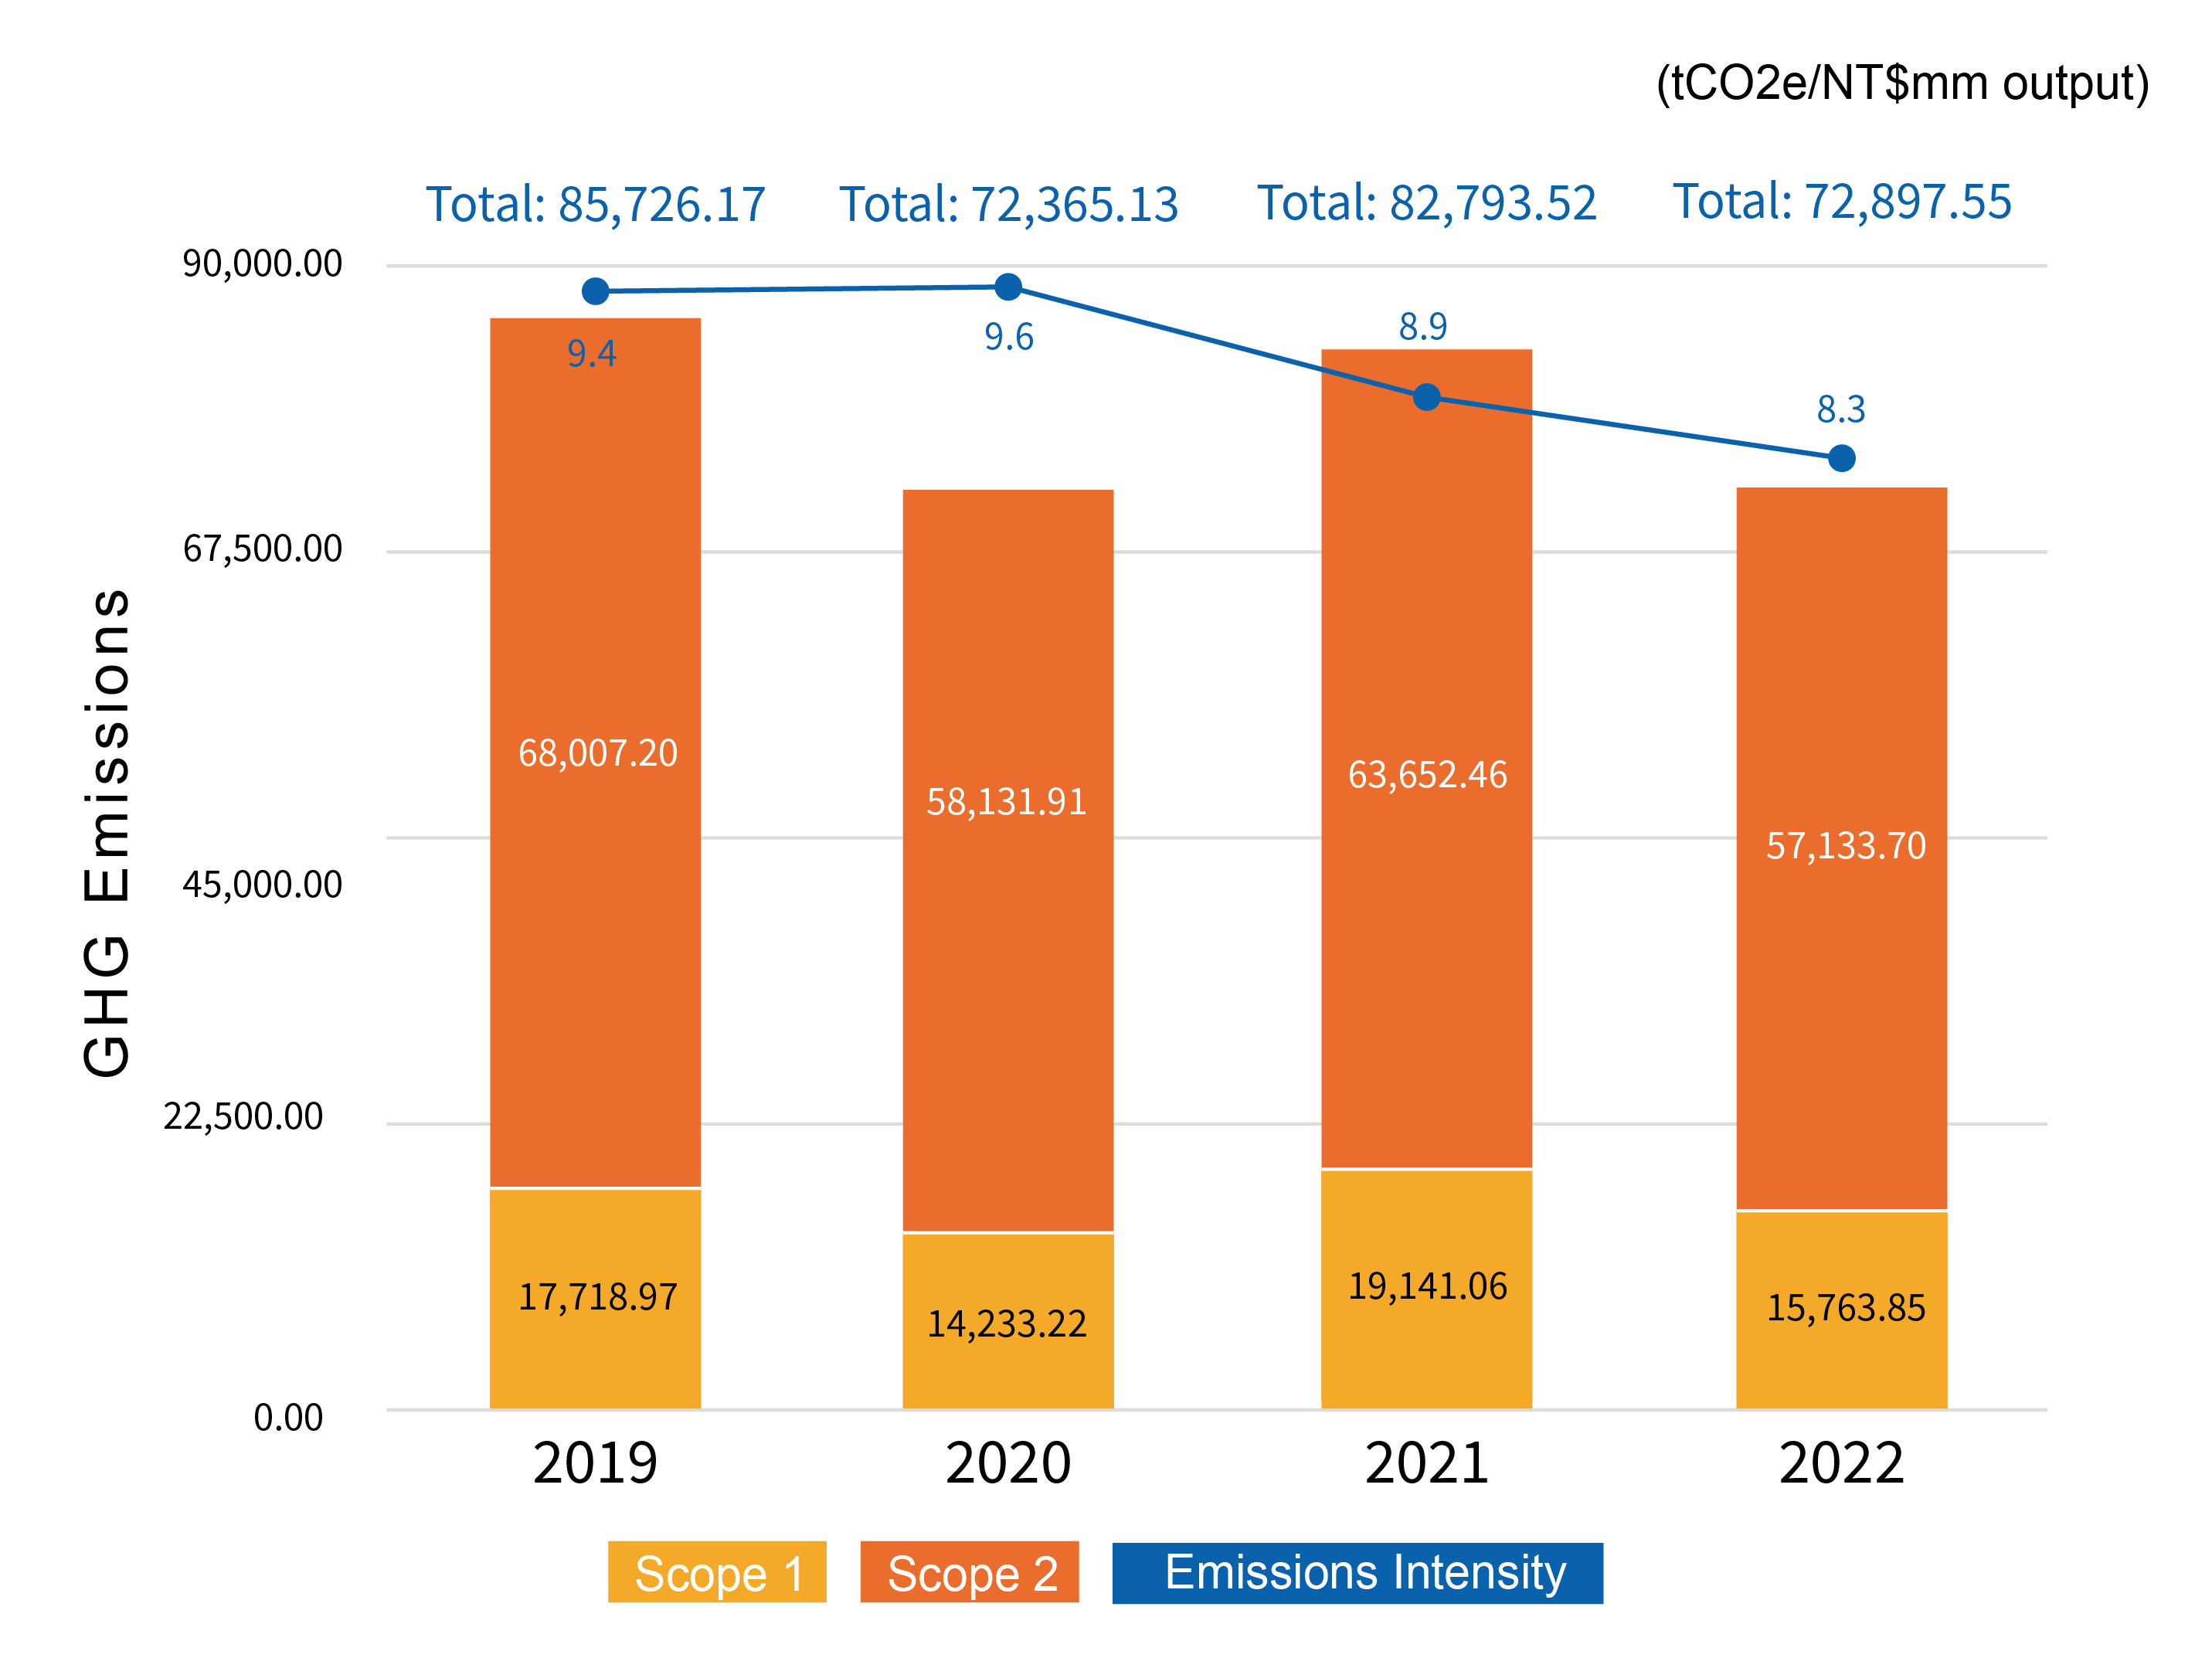
2019-2022 GHG Emissions Intensity
Note:
- The GHG emission factors used are based on the GHG Emission Factor Management Table Version 6.0.4 announced by the Environmental Protection Administration.
- Information on global warming potential in the Fifth Assessment Report (2013) conducted by the United Nations Intergovernmental Panel on Climate Change (IPCC) was used as the basis for the calculation.
- We used the operational control approach and included the scope 1 and scope 2 GHG emissions from each production site. Our GHG inventory covers carbon dioxide, methane, nitrous oxide, hydrofluorocarbons, perfluorocarbons, sulfur hexafluoride, and nitrogen trifluoride.
- Scope 3 emissions are emissions from sources that are not owned or controlled by the Company and therefore the exact amount of emissions is hard to collect. As a result, scope 3 was excluded from inventory.
- The emissions statistics above are rounded to two decimal places and are used to calculate emissions intensities.
- Since 2005, Everlight Chemical has passed ISO 14064-1:2006 certification for six consecutive years (coverage: ECIC Plant I-III), so the 2019-2020 statistics were calculated using the same methodology. We have scheduled to obtain third-party verification in August, 2023.
- 1. Electricity savings (%)= [Electricity savings/ (Total electricity consumption + Electricity savings)] x 100%
- 2. According to the Environmental Quality Protection Foundation (EQPF), every year, a tree can absorb about 12 kilograms of CO2e(http://www.eqpf.org/sf/3-1.htm)). 511 tons divided by 0.012 tCO2e/tree equals 42,583 trees.
- 3. When conducting GHG inventory, we found that equipment that contained refrigerants still used R22 refrigerants (subject to the Montreal Protocol control but not included in GHG inventory; we have disclosed emissions information related to ozone-depleting substances below). In the future, we will gradually phase out such equipment.
2022 Energy Conservation & Carbon Reduction Performance
Location | Measures | Electricity Savings (MWh) | Heating Value Reduction (10⁶ kcal) | Emissions Reduction (tCO₂e) | Energy Savings (GJ) |
ECIC Plant I | Replacement of A04 ice machine in Building A | 216 | 186 | 110 | 778 |
Replacement of J11 air compressor in Building J | 100 | 86 | 51 | 361 | |
Replacement of L01 chiller in Building L | 164 | 141 | 84 | 591 | |
ECIC Plant II | Replacement of ice machine in Building G (for color chemicals) | 122 | 104 | 65 | 437 |
Replacement of chiller (for color chemicals) | 45 | 39 | 24 | 162 | |
Replacement of one chiller (for electronic chemicals) | 156 | 134 | 83 | 562 | |
Replacement of one chiller in Building M (for pharmaceuticals) | 15 | 13 | 8 | 55 | |
ECIC Plant III | Installation of frequency converters for cooling towers in Building P | 11 | 10 | 6 | 41 |
Trend Tone Imaging | Replacement of adsorption dryers with water-cooled (refrigerated) dryers | 89 | 77 | 47 | 320 |
Everlight Suzhou | Replacement of old water pumps in Building K with two 11KW energy-efficient water pumps | 19 | 16 | 10 | 68 |
Replacement of one outdated cooling tower in Building K | 43 | 37 | 23 | 155 | |
Total | 980 | 843 | 511 | 3,530 | |
- Note:
- The calculation of electricity savings and carbon emissions in 2022 was based on the electricity emission factor (0.509 kg CO2e/kWh) announced by the Bureau of Energy in 2021 and related coefficients in the Energy Statistics Handbook published in 2021.
- Heating value reduction (kcal) = [Electricity savings (MWh) X Heating value of electricity (8.6 x 10⁵ kcal/MWh]
- Emissions reduction (tCO2e) = [Electricity savings (MWh) X The latest electricity emission factor (0.509 tCO2e/MWh)].
- Energy savings (GJ) = [Heating value savings (kcal) X Heating value factor ((4.187 x 10³ (J)/kcal)) ÷ 109
- The figures above are rounded to the nearest integer.
Historical Ozone Depleting Substance (ODS) Emissions
No Data Found
1. The calculation of ODS was based on the ozone depletion potential (ODP) published by the Montreal Protocol.
2. The ODP of R22 refrigerant is 0.055 (in accordance with the Montreal Protocol) and the ODP of CFC-11 is 1. The above chart converts R22 usage into CFC-11 equivalent (ton).
GHG Emissions Management Performance
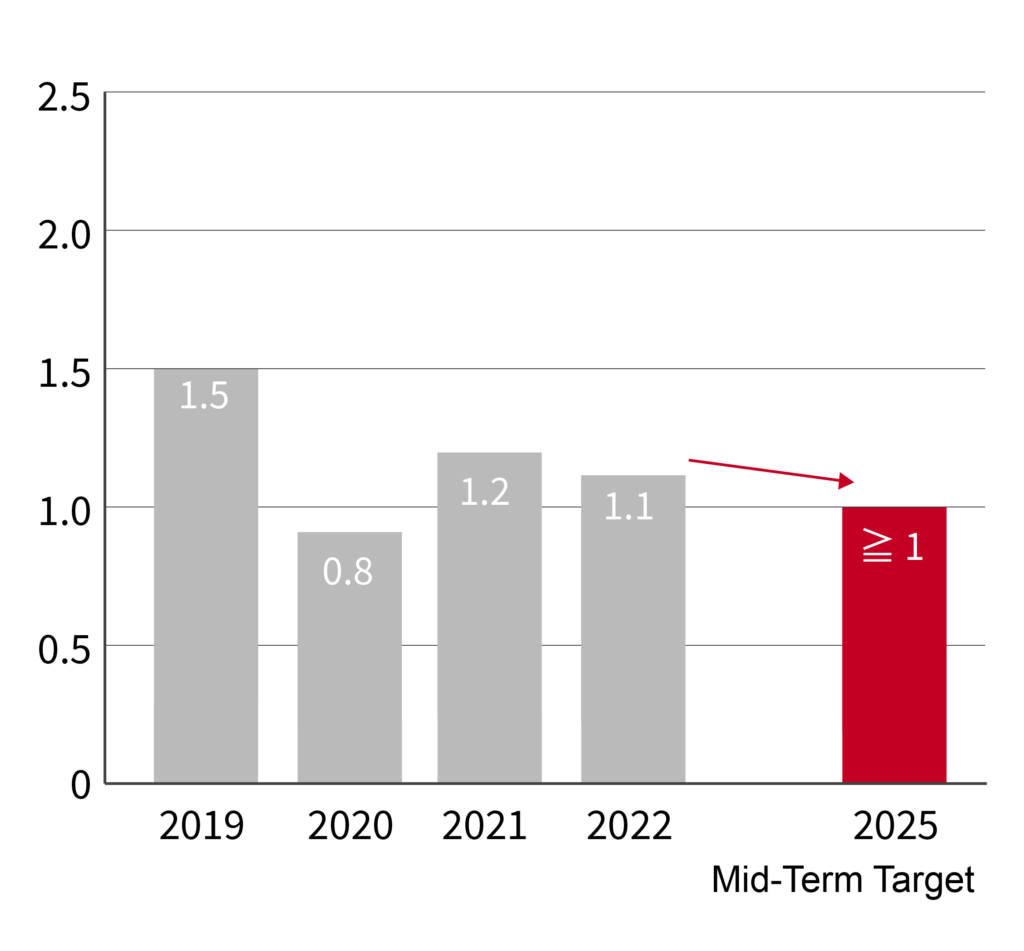
Historical Performance & Progress on Mid-Term Targets
Unit: %
GJ/NT$mm output
1. In 2022, we engaged external experts to assist us in developing energy-saving and carbon reduction plans, based on which we have adjusted our short-, medium- and long-term targets for energy and emissions intensities.
2. The main reason was that COVID-19 had lowered our production capacity and that the production volume for certain energy-consuming products had increased.