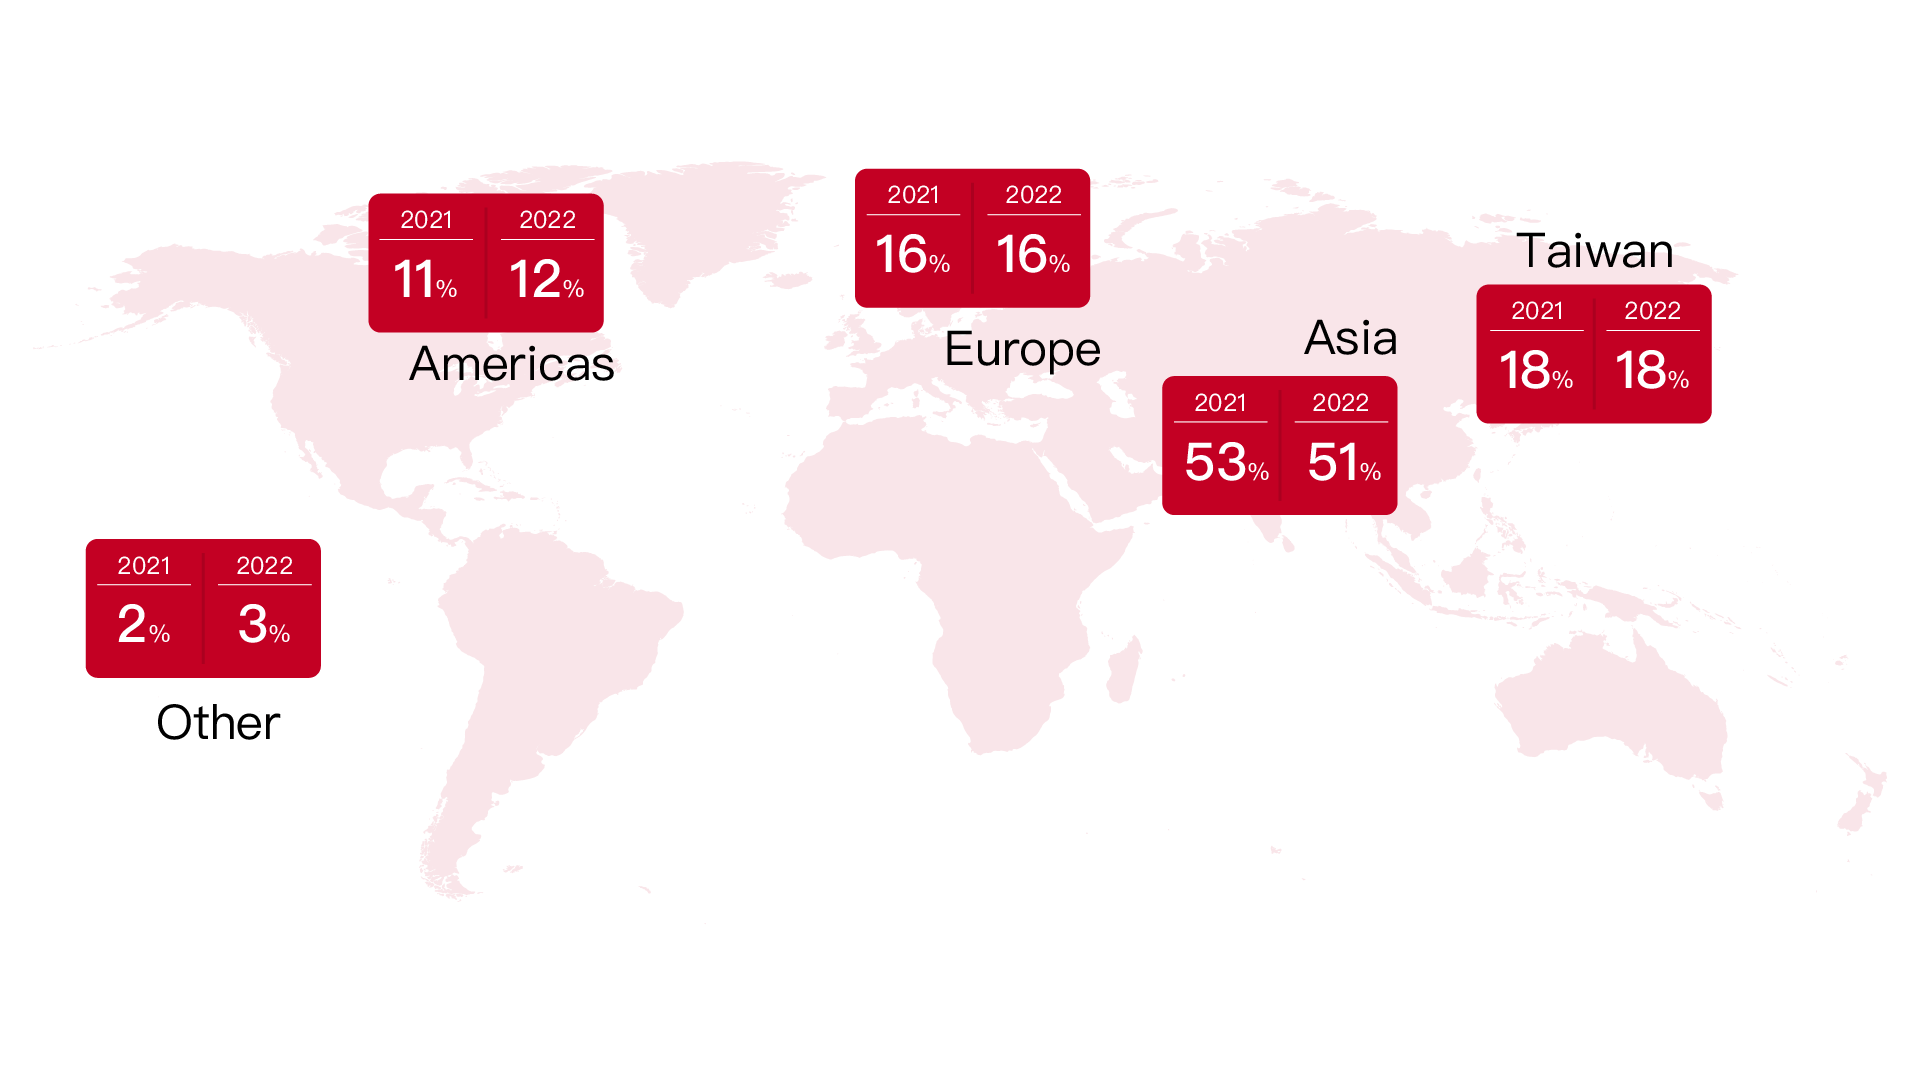
Customers and Markets Home / Overview of the Company / Customers and Markets Home / Overview of the Company / Customers and Markets Changes in Sales Revenue by Market in 2022 Everlight Chemical has built a global network of sales and operations. Our products enjoy a global market presence, with more than half of our customer base in Asia and around 25% in Europe and the Americas. Sales Revenue by Market Americas 2022: 12%2021: 11% Europe 2022: 16%2021: 16% Other 2022: 3%2021: 2% Asia 2022: 51%2021: 53% Taiwan 2022: 18%2021: 18% Sales Revenue in 2022 Unit: NT$ million No Data Found Everlight ChemicalSales Revenue in 2022 (NT$ million)Percentage (As % of Total Sales Revenue)Change in Sales Revenue (vs. 2021)Taiwan1,60824%-2.8%Asia3,21248%-13%Europe1,04315%-11.4%Americas69110%-11.9%Other2283%20.1%Total6,782100%-9.7% GroupSales Revenue in 2022 (NT$ million)Percentage (As % of Total Sales Revenue)Change in Sales Revenue (vs. 2021)Taiwan1,64718%2.4%Asia4,56951%-7.0%Europe1,38316%-7.5%Americas1,04412%7.3%Other2493%19.2%Total8,892100%-3.4%