Operational Performance
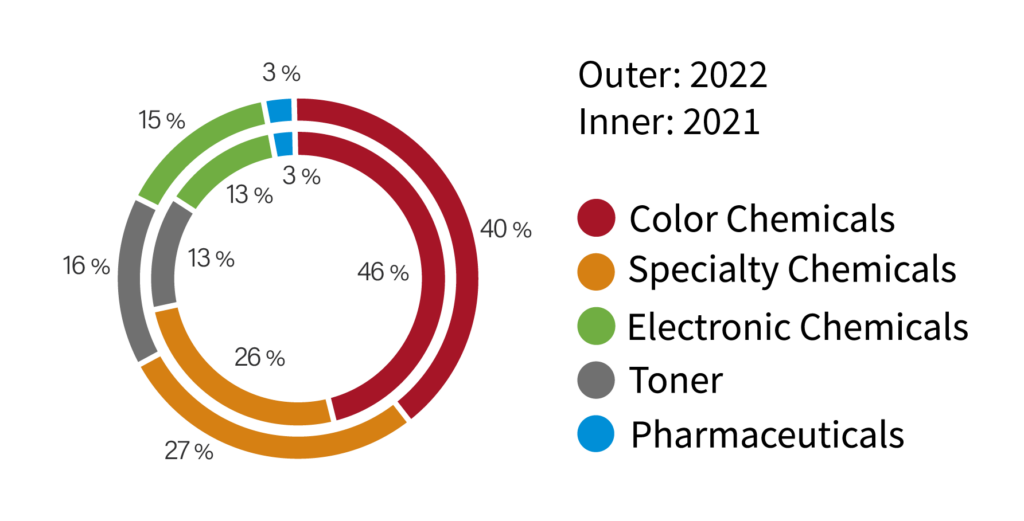
2022 vs 2021 Revenue by Business Unit (Group)
No Data Found
No Data Found
No Data Found
No Data Found
Item | 2020 | 2021 | 2022 |
Operating revenue (NTD thousand) | 6,085,544 | 7,509,370 | 6,782,782 |
Operating cost (NTD thousand) | 5,005,499 | 5,847,516 | 5,413,588 |
Operating profit (NTD thousand) | 210,185 | 450,009 | 265,176 |
Net income after tax (NTD thousand) | 213,279 | 472,970 | 374,432 |
Earnings per share (EPS) (NTD) | 0.39 | 0.86 | 0.68 |
Item | 2020 | 2021 | 2022 |
Operating revenue (NTD thousand) | 7,769,066 | 9,200,988 | 8,891,702 |
Operating cost (NTD thousand) | 6,200,244 | 6,987,506 | 6,896,531 |
Operating profit (NTD thousand) | 204,636 | 552,776 | 380,756 |
Net income after tax (NTD thousand) | 205,022 | 481,829 | 392,540 |
Earnings per share (EPS) (NTD) | 0.39 | 0.86 | 0.68 |